Camarillo Fold Belt: Fault Slip Rates


Results Summary Minimum rates of fault slip, uplift, and shortening are calculated by deformed terrestrial strata and offset geomorphic surfaces. Fault slip rates on the major faults in the study area are between 0.9 mm/yr and 1.1 mm/yr. Shortening is dominantly on steeply-dipping reverse fault, which result in folding and uplift that is 3x greater than fault slip rates (2.1 -3.4 mm/yr). This may explain why geodetic surveys do not show significant horizontal shortening across the fold belt. Locally, shortening, magnitude of tilting and uplift decreases westward along fold complexes suggesting westward propagation of fault systems. A maximum Mw 6.8 earthquake for the Simi fault is estimated, if the rupture were able to propagate along the entire fault length across all intervening orthogonal cross-faults.
Methods
1) Geologic Mapping
2) Optically Stimulated Luminescence of folded and faulted extensive sedimentary strata and fluvial terrace surfaces.
3) Paleoseismic trenching
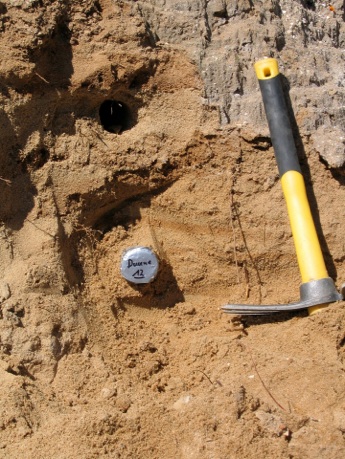

The luminescence signal derived from OSL and IRSL analyses records the elapsed time since sediment was last exposed to sunlight during transport and, therefore, the burial age. Samples were collected in light-safe tubes from fine-grained sand bodies.
Geologic map of the Camarillo fold belts
Structure map of the Camarillo fold belts showing the major fault and fold names
Paleoseismic trench across the Camarillo fault/fold

Table of Geochronology Results
Table of fault slip rates
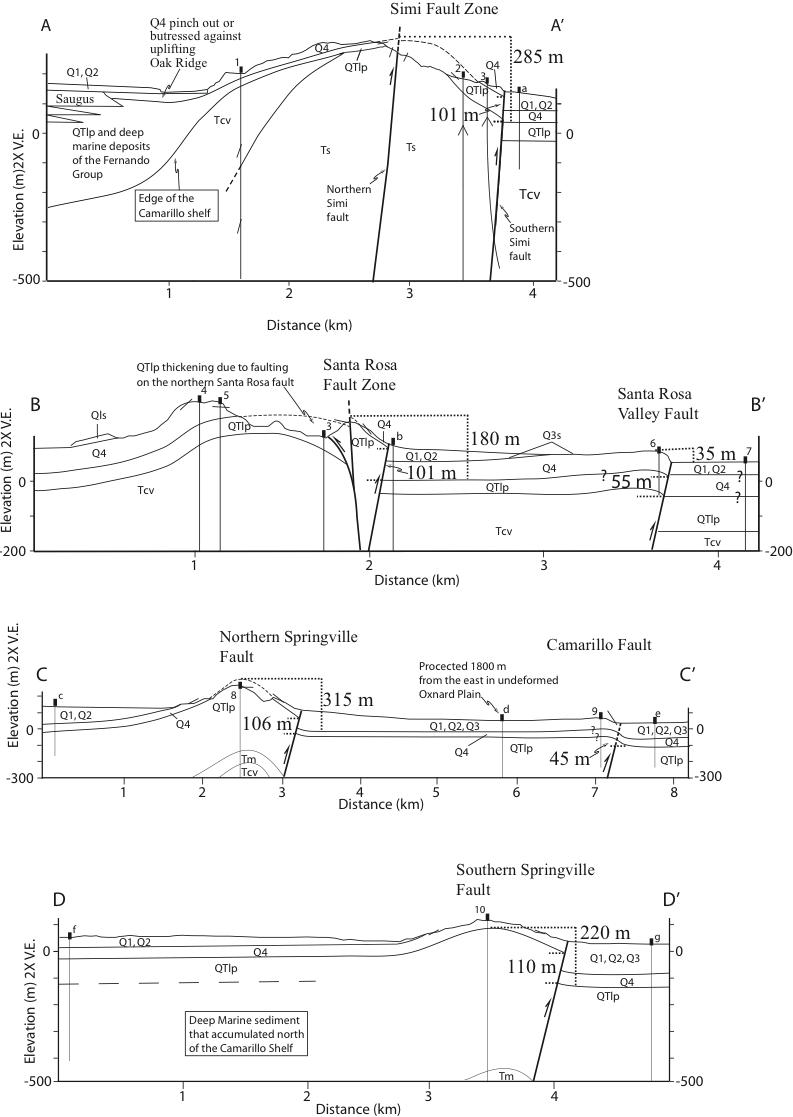

Cross sections across across the major folds in the Camarillo fold belt. See structure map above for the location of cross section lines. Note that most of the shortening is accommodated by folding and not fault slip (see Table 3 below).
